Volatility explained: one number for how hard the price swings, both ways
Volatility measures how far a price typically swings, up or down, over a period. It's usually the standard deviation of daily returns, scaled up to a year. It tells you how rough the ride is, not which way it goes.
Picture the price board at the trading post on a nervous day. The clerk chalks a number at breakfast, wipes it off by lunch and chalks a much lower one. By supper he has rubbed that out too, and the new number is almost back where it started.
A prospector who checked only at breakfast and supper would say nothing happened. One who had to sell at lunch would tell a different story.
That's volatility: how far and how often the price swings, whatever direction it ends up in. It has a number, and the number is a measure of the ride, not a map of the road.
What it is
Volatility describes how much a price moves around its average over a period. The usual measure is the standard deviation of returns: take the daily percentage changes and work out how far they typically stray from their own average.
Because crypto trades every day of the week, crypto volatility is usually scaled to a year by multiplying the daily figure by the square root of 365. Deribit, a crypto options exchange, does exactly that for its volatility index, DVOL, which "gives the 30 day (forward-looking) annualised expectation of volatility". Its rule of thumb for the way back: divide the yearly figure by about 19.1, the square root of 365, to get a typical daily move (Deribit, 2021).
How it works
A small worked example, with made-up numbers. A coin starts at 100 euros. Over five days, its daily returns are:
- plus 5% (to 105.00)
- minus 3% (to 101.85)
- plus 1% (to 102.87)
- minus 5% (to 97.73)
- plus 2% (to 99.68)
- Average return. 5 minus 3 plus 1 minus 5 plus 2 is 0. Divide by 5 days: the average daily return is 0%.
- Distance from the average, squared. 5 squared is 25, 3 squared is 9, 1 squared is 1, 5 squared is 25, 2 squared is 4. Total: 64.
- Average the squares. For a sample, statisticians divide by one less than the number of returns: 64 divided by 4 is 16.
- Square root. The square root of 16 is 4. Daily volatility: 4%.
- Scale to a year. 4% times 19.1 (the square root of 365) is about 76% a year.
Notice the coin ended the week almost where it started, down 0.32%. Its volatility was still 4% a day. Volatility doesn't care where you end up, only how wild the trip was.
What does 76% a year mean in plain words? Roughly, a typical daily move of about 4%, in either direction, every day. And bigger days than that are not rare.
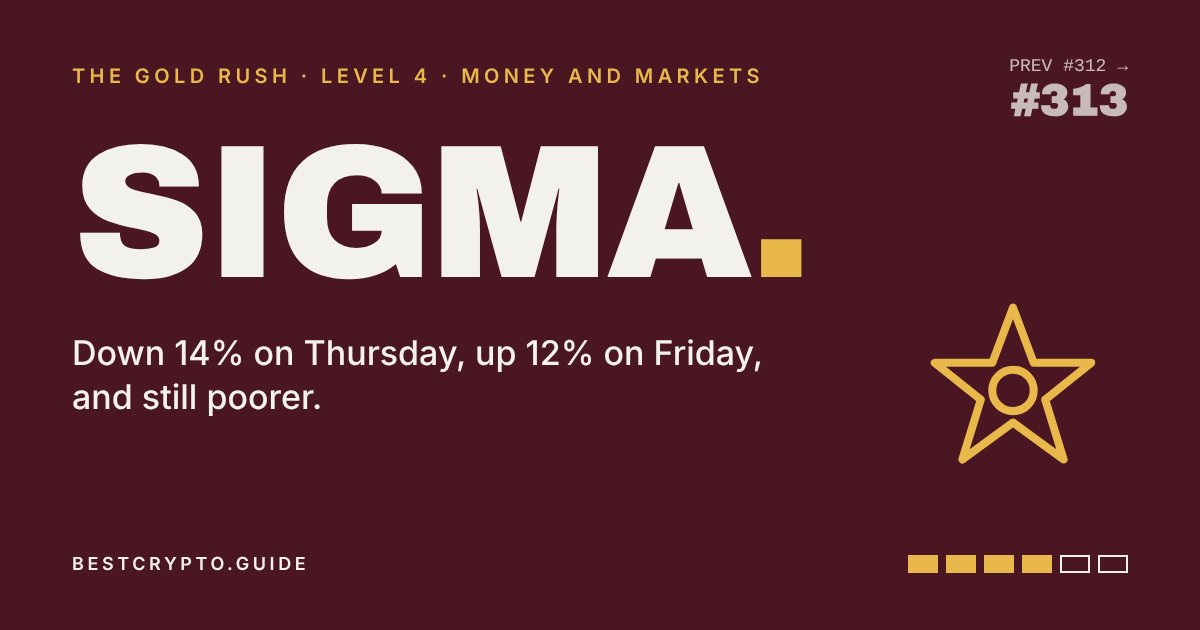
A real pair of days. Coinbase's BTC-USD daily candles for February 2026 (Coinbase Exchange):
- Thursday 5 February 2026 (UTC): opened at 72,999 dollars, closed at 62,791. That's minus 13.98% in one day.
- Friday 6 February 2026: opened at 62,788.28, closed at 70,527.70. That's plus 12.33%.
Two days, two moves of more than 12% each. From Thursday's open to Friday's close, the net change was minus 3.39%. Down 14%, up 12%, and still poorer: a 14% fall needs more than a 14% rise to recover, because the rise starts from a smaller number.
Why it matters
The sheriff's warnings are about this. The EU's three financial supervisors warned in March 2022 that "many crypto-assets are subject to sudden and extreme price movements and are speculative", adding that the price "often relies solely on consumer demand" (ESAs, 2022). In the UK, crypto adverts aimed at consumers have had to carry the line "Don't invest unless you're prepared to lose all the money you invest" since 8 October 2023 (FCA).
Who gains. Volatility is good business for the shovel sellers. Every big swing brings people back to the app, and every trade pays a fee. It's the raw material for the saloon too: big moves make good screenshots.
Who pays. Anyone forced to sell at the wrong moment, and anyone borrowing to trade. A 4% daily swing is uncomfortable with your own money. With borrowed money it can close your position before the price comes back. "Leverage explained" has the arithmetic.
Where people get it wrong
- "High volatility means the price will go up." It means the price moves a lot. Down counts too.
- "Volatility is the same as risk." It's one part of it. A coin can sit perfectly still and then go to zero when an exchange or a project fails.
- "The chart has been calm for weeks, so the coin is safe." Past volatility is a description, not a promise. Calm periods have ended suddenly before.
- "A 20% fall and a 20% rise cancel out." They don't. 100 minus 20% is 80, and 80 plus 20% is 96.
Check the worst day, not the average
Before you buy any coin, look at its price chart over a year and find the worst single day. Then ask: if that day came the week after I bought, could I sit through it without selling or borrowing?
If the answer is no, the amount is too big. The board will swing. The question is only whether you have to sell at lunch.
Frequently asked questions
What is volatility in crypto?
Volatility is a measure of how much a coin's price moves up and down over a period. It's usually calculated as the standard deviation of daily returns and often shown as a yearly percentage. It describes the size of the swings, not their direction.
How is volatility calculated?
Take the daily percentage returns over a period, find their average, and work out the standard deviation: how far the returns typically stray from that average. For crypto, which trades every day, the daily figure is usually multiplied by the square root of 365, about 19.1, to give a yearly figure.
What does an annual volatility of 76% mean?
Divide by about 19.1 to get the typical daily move: roughly 4% in either direction. Bigger days happen regularly in crypto, so treat it as a typical swing, not a limit.
What is DVOL?
DVOL is a volatility index published by the crypto options exchange Deribit. It uses option prices to give the market's expected volatility over the next 30 days, as a yearly figure. It's an expectation, not a forecast anyone guarantees.
Is high volatility good or bad?
It's neither in itself, but it makes losses larger and faster for anyone who must sell at a bad moment or who trades with borrowed money. Regulators in the EU and UK warn that crypto prices can move suddenly and that people can lose all the money they invest.
Sources
- Coinbase Exchange, BTC-USD daily candles, 4 to 7 February 2026 (public API, read on 19 November 2026)
- Deribit, DVOL: Deribit Implied Volatility Index (31 March 2021)
- EBA, ESMA and EIOPA, Warning to consumers on the risks of crypto-assets (17 March 2022)
- FCA, FCA introduces tough new rules for marketing cryptoassets (8 June 2023)